Understanding the Potential of Heat Maps: The Key to Successful UX Research
Heat-maps are all in the rage today. From weather forecasters using them to every user-centric company on the planet, everyone loves to use them. Why wouldn’t they? Heat maps are a tool of choice for many when they need to make sense of heaps of data. Instead of wading through pies, graphs, tables, and charts, you can instead use heat maps to see the trends. No interpreting charts or understanding different graphs. Yes, it is that easy.
Heat maps are one of the most widely used tools to showcase statistical data. Not just engineers and companies, researchers, marketers, sociologists, and even doctors use it. What makes it so popular is that while not everyone understands traditional analytics but almost everyone can interpret heat maps with a visual analytics tool.
What is a Heat Map?
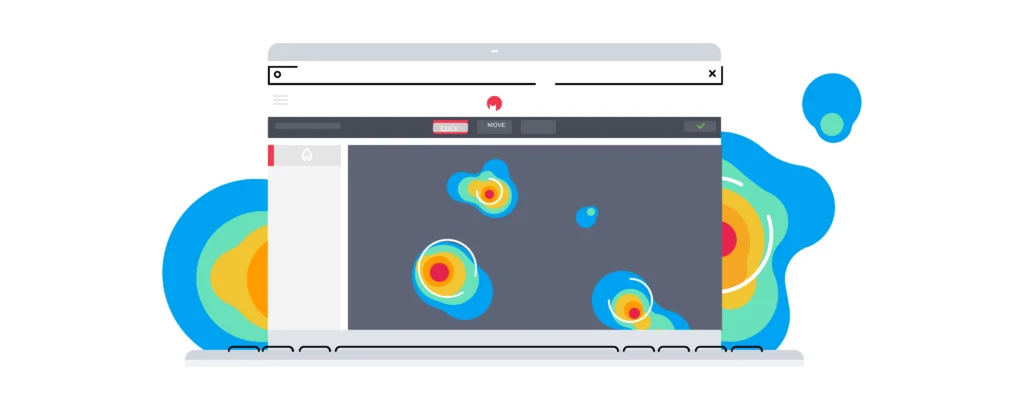
A heat map is a visual analytics tool in UX Research that relies on colors to interpret the data for you. Use it when you need to know how a web page is performing and what’s catching the attention of your users. The heat map shows you in a simple and comprehensible way the information that’s most important for you – your user’s attention.
Chromatic Symphony: Choosing the Kaleidoscope of Colors in UX
Your website color would play an extremely important role in the world where you are living at present. Your website color has the ability to influence your level of thinking, cause a number of reactions and change different actions. 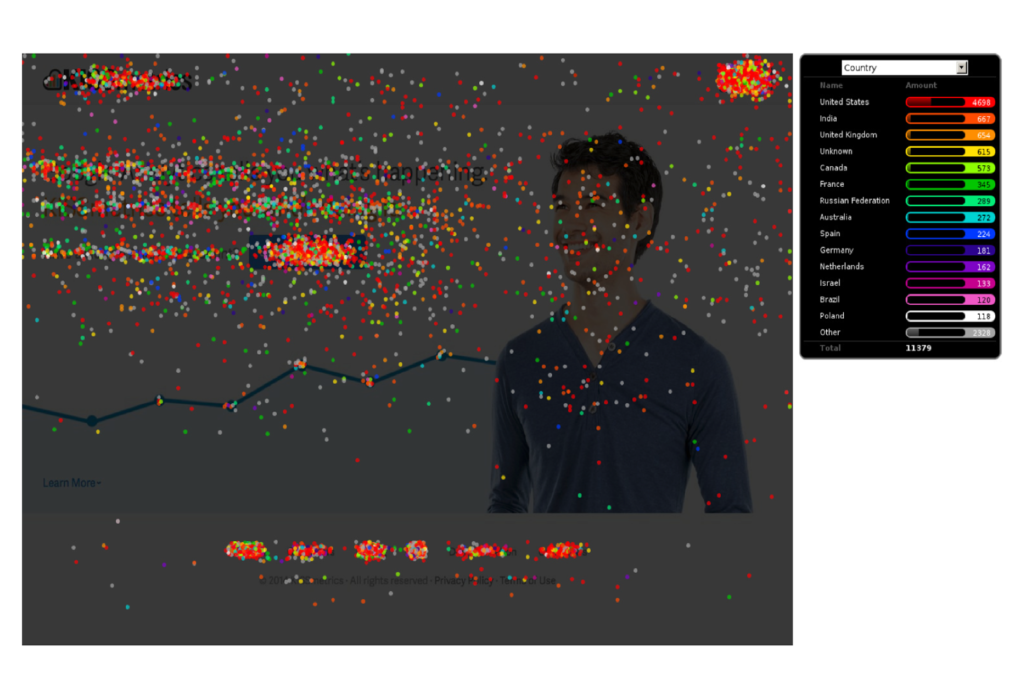 It also has the ability to soothe or irritate your eyes directly, cause an increase in your blood pressure level or cause a decrease in your appetite. While you go about using color in the best manner, it can save a lot of energy consumption as well. “Use color as a mood-lifting design tool that evokes calm, drama, cheer, or comfort,” says Jeanne Matteucci in her book “The Psychology of Color.”
Even Though color psychology is pronounced to be a more unique concept, you should be clear that it would be affecting a lot of moods in the world more than regularly possible. Heat maps use warm and cool colors to show you which part of the website attracts the most of the user’s attention. Curious to know what a heat map of a webpage looks like. Here is a reference. When you put color psychology into the picture, you can note that it has a lot to do with how you would perceive things when you view a thing or two. Everything you need to know about a page is on your screen.
Right from the CTA that grabs most of the gazes of your users and the F-shaped pattern that their gaze makes. Heat maps aren’t prying on your users instead, it is a form of visual storytelling. When you have a heat map available to you, you can easily answer the most important question which is if your users are seeing the most important part of your page.
From Data to Visualization: A Comprehensive Guide to How Heat Maps Work
As shown in the above pic, the heat map uses the data collected from a web page and then lays it out over the page for you to see. So, how do we collect the data? We start by taking a snapshot of the page. We add a small JavaScript to your website’s code so that a copy of the current live page loads in our servers. We then map all the elements on that page including the copy, interactive elements and visuals. We then attribute every task that a user takes on that web page.
Of course, we limit this interaction to just unique users. You wouldn’t want biased information. When we have mapped enough user interactions, we have the analysis ready to show to you.
We record every tap on any link on the page. But this will only give you an idea of the most popular part of your website. But, what if you need more information? We can help you record the slightest thing that the users do, including if people are reading your copy. Read on to know about how we do that.
Capture the clicks.
Heat mapping data is quite important for UX design decisions. You need to gain a better understanding of how all your users would interact with your website.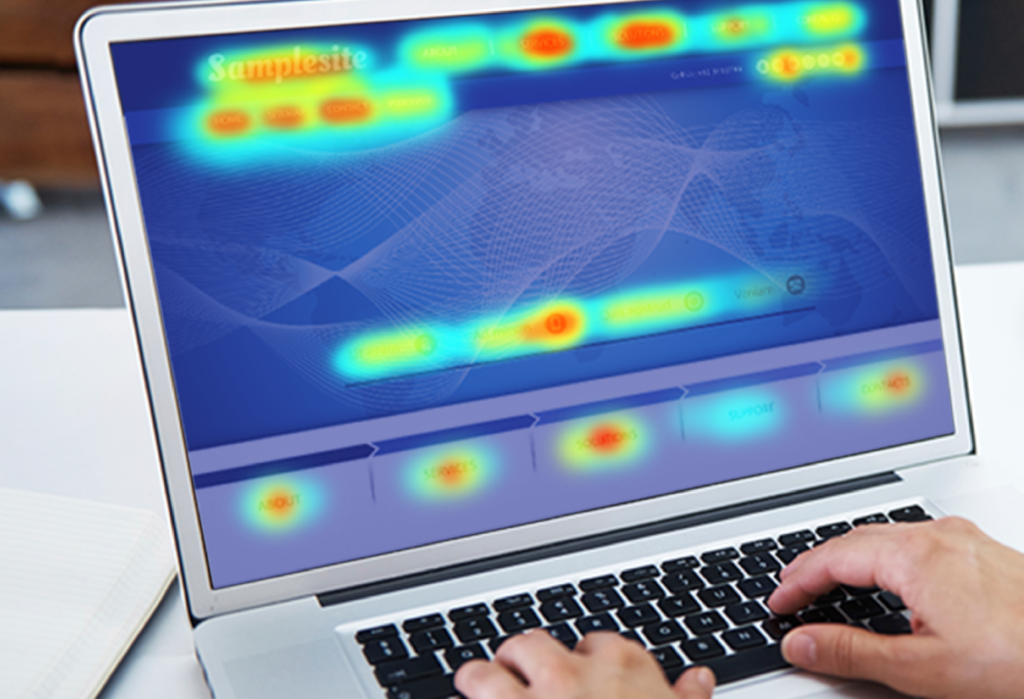 Spotting the trends in your user actions and identifying if there are any friction points when it comes to your experience is also quite important. With Heat maps, you have the opportunity to drive all your conversation within what happens to your organization. They are going to be quite easy to interpret and understand as well.
Having plenty of this data in your GA would also provide you with the power to get your heat map rolling through a number of user choices such as browser, device, source, purchasing behavior and much more. Our heat maps can capture the effectiveness of your CTAs and see if the users are paying heed to the CTA. This translates to gaining useful insight that will bring you a valuable tool to improve the conversion of your funnel. The more clicks a CTA generates, the brighter it glows in the heat map. With just one glance at the hot spots on the heat map, you can identify the most important buttons on your website.
Are users even reading your copy?
What if you need to monitor more than just clicks? How about the description copy that you spent so much time and resources shaping? We can help you check if the information displayed on the website is being read by your users. We do this by following the flows of the cursor and creating a hover map. Interesting, right? This tells you a lot about the copy on your website. It tells you what content is being read the most.
It can even tell you the center of attraction for CTAs or website copy. You can use that knowledge to offer your users the kind of content that they want instead of creating copy that you think will work the best.
If you notice a sharp color change on the heat map, it tells you that the users can’t relate to the section that follows. This section may cause massive drop-offs for your users on that page.
Bring out the confetti.
Confetti means colorful papers, metallic materials, or myriads that you throw up on your birthday bash. Why do we have to bring it upon heat maps? 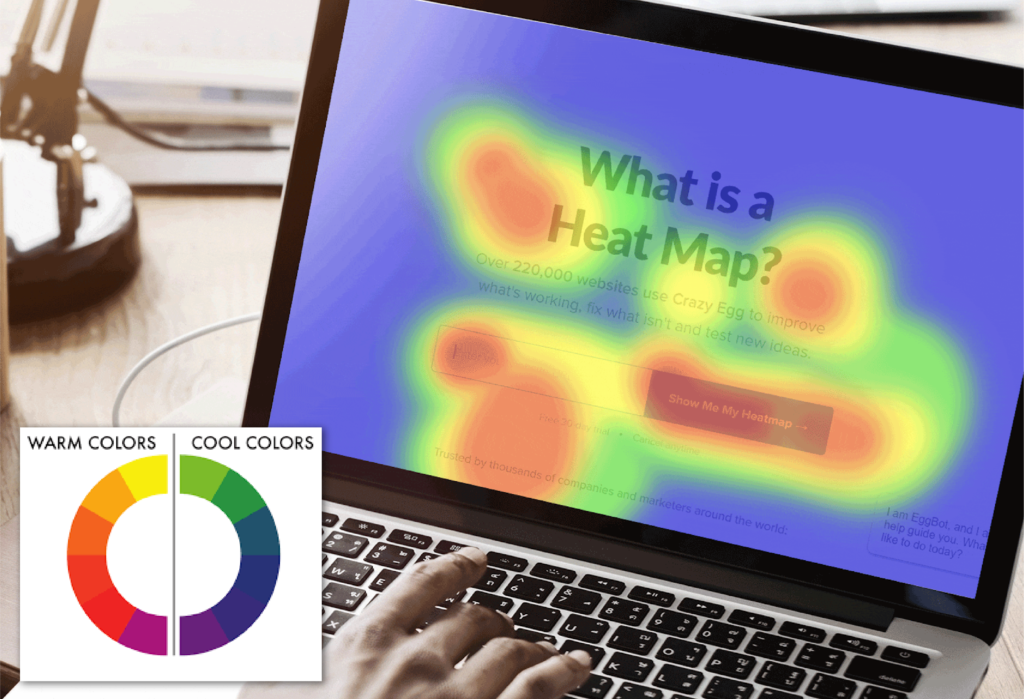 Well, there is a perfect reason behind it. You should know that the origins of this word are from the Latin word called confected, which means confetti, also the plural of Italian confetti or otherwise known as the small sweet. You get a number of benefits with a Confetti heat map.
The confetti heat map is similar to the classic heat map except that it lets you see each click on the page instead of the density of clicks. This is quite insightful as it tells you if your users are getting confused and trying to click on the non-clickable areas. You can then concentrate your efforts on reducing their labor.
It can also help you to reduce the bounce rate on that page. It can show you if your users are getting confused by clicking the non-clickable parts and you can work on improving them. This also lets you track different metrics like the source of traffic – if your users read your email campaign or visited from your ad campaign.
Get the percentage of clicks.
Need more insight? Check out the percentage of clicks heat ma that complement the classic heat map. It lets you see the clicks generated on the website at percentages per element. You can see the number of clicks generated by each element including CTAs or images. To have the capability to quantify the clicks per element is very important. You need to know how much importance your users give to each of the elements on the page so that you can guide your efforts accordingly.
You can see in the thumbnail above that there are small plus signs on the page. You can then further dive deep to understand the demographics of the clicks including new vs. returning users and choice of platform. You can also check if the different non-clickable elements on the page were mistaken to be CTAs and clicked by the users.
What is a heat map used for?
You should always have a heat map active on your website and you should monitor it occasionally. We have listed down a few scenarios where you can find heat maps to be especially useful.
Website redesign:
Do you have an idea that poor website design has the ability to hurt all your sales conversions? It is always best that you implement ways where your website would look attractive altogether.  It is not of importance if your company size is small or big. You should implement the right methodologies to make your website work among your audience. It is extremely important that you implement a strategic approach. You should have a fair idea about what is working and what is not. Your knowledge about what works currently and what is not working also matters a lot. Companies spend months and even years thinking about their redesign.
Redesigning a website can be an expensive and time-consuming affair. Heat mapping can help you ensure that your new website overcomes the problems of your previous one and leads to more conversions. You won’t want a website that fares worse than the website it is replacing. From color combination to highlight areas and content optimization, heat maps help you in more ways than one to build your next website. Be sure of the changes you want to implement by having a heat map before you start the process. It will save you a lot of headaches afterward.
Understand A/B tests better:
A/B test is a controlled experiment that tells you which design among the two versions performs better. A/B testing is used extensively by market leaders to implement their decisions.  Heat maps can help you gain more insights on the A/B tests you run. Your team should clearly define what goals you would want to achieve, You should also understand that if your website is unattractive, it would require a complete changeover in the form of a website redesign.
Otherwise, the traffic would below. People might not prefer to visit your website. It can help you discover what your users do differently between the two landing pages, CTAs, and other elements. It gives you more insights into what works in the better-performing variant. Was it the copy? Was it the placement of the section? Or was it the color of the CTA? The issue with A/B testing is that it can’t tell you why one version works better than the other and it is why people resort to introducing smaller changes between the variants.
With heat maps, you can learn what catches your user’s attention and what they click so that you can use A/B testing to its maximum potential.
Content Marketing:
How do you know if your users are reading the words you write for them on the website? With our scroll maps, you can see how far down do the people scroll to read the content.  See which of your CTA converts the most and take that learning to improve the CTAs across your website. How does this translate in to real life? For example, let’s say that you dig your heels and frame a masterpiece of a blog post that is over 3000 words long on something as important as account safety.
The post has a CTA in the end that lets users set up 2FA on their account. This blog post gets a steady amount of traffic from all the posts, features, and mentions on social media. But the heat map shows that people only a fraction of people are scrolling down to read the entire post. Instead of being worried about the length of the post, you decide to check the confetti report. It tells you that nearly everyone who reads the post taps the CTA. This changes equations. Your blog is already segregating the unqualified leads from the qualified ones. Yes, you can get such beneficial insights immediately from heat maps.
UX and Usability Testing:
UX and Usability Testing play a wide role in engaging your user. You might want to build an amazing product with these two methods but you need the right team support to take it to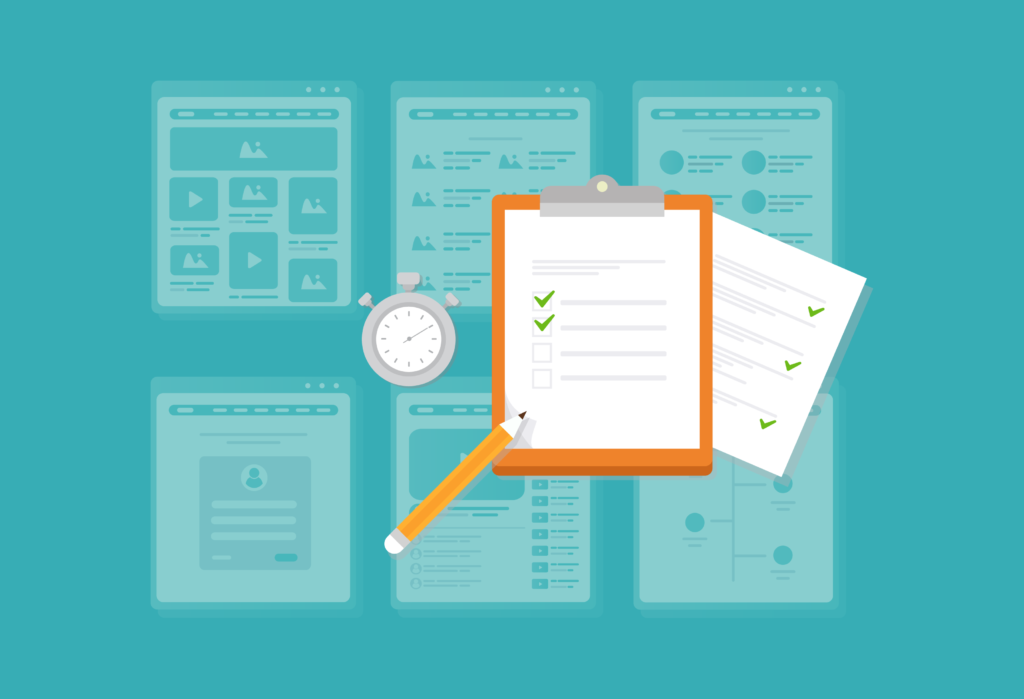 the next level with your team members. What if you wanted to test the UX and usability of your website? Have you heard of the $300 million button? When an e-commerce giant replaced the ‘Register’ with the ‘Continue’ button and made it optional for buyers to create their accounts, their revenues shot up by $300 million in that year. You may want to do a little bit of UX testing of your own on your website.
This is where heat maps will come in handy. It can tell you where your users are clicking and where they are getting stuck. It will show you the prominence of your CTA buttons and if they are drawing the attention of your users. Is your user clicking something that isn’t clickable? Change that. Are your users confused about a line of copy? Edit it. Use A/B testing coupled with heat maps to see how these small changes make a world of difference compared to your base version.
Conversion Funnel:
A conversion funnel is the best ever way to visualize your flow as well as the conversion path. They can provide your potential customers with payment. You should generate all the visitors through a number of methods like 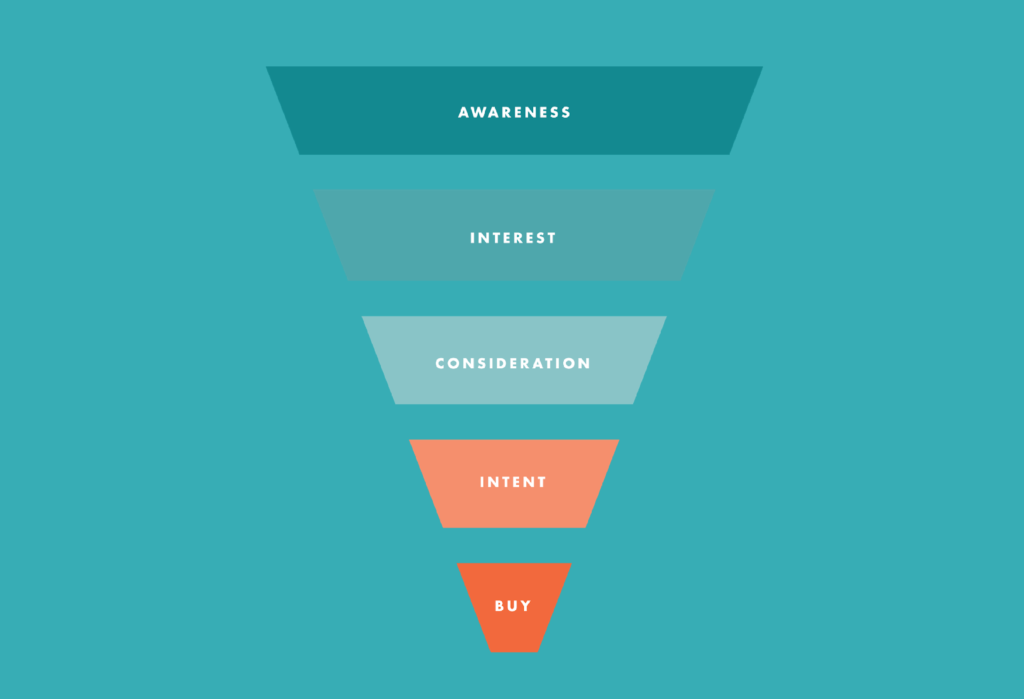 paid ads, content marketing, SEO, and social media marketing, and focus on cold outreach. You should take care of online business with people who must take care of their customers. Your company should know that ad supported businesses would have their own exceptions.
The truth is customers are not more inclined towards Ad services. Even when people would attempt to sign up for all your online services. You should also purchase your product from all your websites. Your funnels would help you to set all this process (or processes) in quite an easy manner when you can give us a visual guide on your conversion data. You can significantly improve your conversion funnel with the help of heat maps.
It can help you understand the user’s pain points and improve the usability and UX of your website. Right from understanding why your users are dropping off to any confusing element and what catches their fancy on the website, you can use the data to your advantage.
What is the difference between heat maps and eye-tracking?
Heat maps take into consideration the movement of the user’s fingers and the clicks they make. Eye-tracking is based on analyzing the gaze of the users and noticing which part of the website are they paying the most attention to. Just like heat mapping, eye-tracking also highlights the most prominent sections in warm colors. Eye-tracking is a little more expensive affair because of the extra equipment cost involved.
Boost Your Knowledge: Carry Your Learnings Forward
It’s critical to comprehend which headlines interest your audience and capture their attention. User interaction can also be improved by adding imaginative visuals or interactive images. Consider linking a picture to pertinent material if people are constantly clicking on it to keep their interest. It’s crucial to check that all of your website’s sections are accessible and simple to find, and to see if the navigation is working as it should. Users can easily access their intended areas thanks to seamless navigation. Monitoring how much content people read gives you useful information about their level of engagement and aids in improving the user experience on your website as a whole.
Utilize Heat Maps’ Power to Astound Your Users
With the aid of Pattem Digital’s proficiency in the usage of heat maps, you may improve your company and receive insightful information about user behavior. You can improve user experience overall, optimize conversions, and comprehend user preferences by utilizing heat maps. As an established eye-tracking company, our team is prepared to help you quickly and effectively build up your first heat map. To begin this transforming journey, please leave a remark below, send us an email at business@pattemdigital.com, or ask any questions. Together, let’s realize the potential of heat maps!
